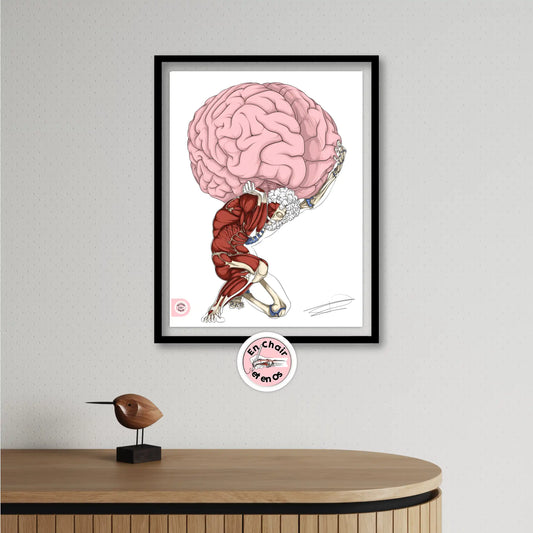
The brain is often presented as the most fascinating part of the human body. It orchestrates information, language, cognitive memory, emotion, movement, and the control of numerous vital functions. Yet, its structure remains complex to explain without a clear anatomical aid. This is precisely where the brain anatomical chart becomes essential: a rigorous illustration, designed as an educational resource and learning tool. In this collection of anatomical charts, the goal is simple: to make human anatomy readable, accurate, and usable, whether you are a healthcare professional, a student in training, or an individual curious about science.
A brain anatomical chart is not just a poster: it is a visual representation device built to facilitate the processing of a large amount of anatomical data. It features the major regions of the brain, the lobes, and the main pathways of the nerve impulse. From the cerebral cortex to the nuclei, from gray matter to deep structures like the thalamus, and down to the continuities with the spinal cord, each part plays a role. Many brain functions can be linked to a dominant region or mechanism, while still relying on coordination between several regions.
Brain anatomy: from lobes to system coordination
Discussing brain anatomy first means recognizing that it is a system composed of different regions with their own characteristics. The frontal and temporal lobes are often at the center of explanations because they allow for addressing planning, behavior, and aspects of language simultaneously. The frontal lobe is involved in decision-making, organization, behavior regulation, and the "control" dimension of actions. The temporal lobe, for its part, is classically associated with auditory processing, memory, and certain dimensions of emotion and language.
The parietal lobe provides an essential reading of sensory functions and the integration of information from the body in space. The occipital lobe is the primary entry point for explaining vision and shape analysis, which is useful when illustrating how the brain transforms information into perception. Finally, the limbic lobe is often cited when discussing memory, emotions, and certain motivational mechanisms. These zones are not isolated "drawers": they collaborate constantly, in coordination, and a clear chart allows for visualizing this distributed functioning.
Some charts also highlight deeper structures, such as the corpus callosum, which connects the hemispheres and contributes to interhemispheric communication. One can also address the brainstem, with the midbrain and hindbrain, as well as the medulla oblongata. These zones are indispensable for explaining automatic functions. Their continuity toward the spinal cord helps to understand the path of nerves and the circulation of the nerve impulse within the central nervous system.
Neuron, cell, and axon: the anatomical basis of functioning
A good brain anatomical chart gains strength when it links macro-structure to the micro scale. The brain is composed of billions of cells, of which neurons occupy a central place. The neuron functions as a transmission unit: it receives, transforms, and sends information. The axon is the structure that conducts the nerve impulse over a certain distance, sometimes as far as the spinal cord or toward peripheral nerves. This cellular approach helps to understand the basic mechanism: a nerve message is not an abstraction; it is a physiological phenomenon that propagates and changes.
By visualizing these elements, one can explain the origin of many phenomena: learning, plasticity, development, or the impacts of a neurological condition. For a course or training, these landmarks are essential. A precise illustration allows one to move from a vague description to a solid model: why a region is associated with movement, how a sensory pathway progresses, and how the cerebral cortex organizes part of the processing.
Cerebellum, REM sleep, and global functioning
Some charts in the collection can go beyond the lobes to offer a reading of global functioning. The cerebellum is an excellent example: long reduced to motor coordination, it is now associated with the precision of movement, the control of muscle tone, and aspects of motor learning. Visually, representing it next to the brainstem and the descending pathways to the spinal cord helps to understand its role as a regulator.
REM sleep can also be a relevant theme in a collection: it opens an educational space to talk about cycles, brain activity, and memory. Even if an anatomical chart is not medical imaging, it can help locate the structures often mentioned when talking about alertness and sleep, and provide a visual framework for explanations.
An educational tool for students and professionals
A brain anatomical chart is particularly useful for student learning. In a neuroscience course, the difficulty is not just to memorize names, but to understand the relationships: which regions participate in a function, which pathways connect the cortex, nuclei, brainstem, and spinal cord, and how this organization produces behavior.
For a healthcare professional, the need is often different: a clear, quick, and reliable reference is needed to support an explanation to a patient. The chart then becomes a communication tool, a way to translate complex information into a visual representation. This is particularly useful in medical environments, where precision counts and explanations must remain accessible.
How to read a brain anatomical chart: conventions and orientation
Reading a brain anatomical chart is not just about "recognizing shapes": you must first understand its conventions to avoid misinterpretations. Even before memorizing the lobes or the nuclei, start by identifying the orientation (left/right, front/back) and the type of view: a lateral view does not tell the same story as a section (sagittal, frontal, or horizontal). Next, use the legend as a map: color codes, hierarchy of lines, and numbered references indicate what relates to a structure (cerebral cortex, thalamus, brainstem) and what relates to a function. Finally, keep in mind the most frequent pitfalls: confusing a "deep" structure with a surface structure, mixing up the spinal cord and brainstem, or attributing a complex function to a single region. With these landmarks, the chart becomes a true tool for visual representation and understanding, rather than a simple decorative poster.
Quality of illustration and precision of details: what makes the difference
In a collection of charts, the value of a product relies on the quality of the illustration and the precision of the details. A good chart must offer a coherent anatomical reading, with sections, a clear legend, and a visual hierarchy. The anatomical section, for example, allows for showing brain tissue, gray matter, and other internal structures impossible to understand with an external view alone.
Technical characteristics also count: dimensions of the chart, legibility, contrast, and graphic design. The more readable the chart is from a distance, the more fully it plays its role in a classroom or an office. The advantage of an anatomical chart is to be always available while offering a constant level of reference.
Conclusion: a collection designed to understand the human brain
The structure of the brain is complex, but it becomes approachable when it is correctly represented. Our collection of anatomical charts has a clear mission: to transform a sum of information into a useful, reliable, and educational visual representation. By highlighting the lobes, the cerebral cortex, deep structures, the brainstem, the cerebellum, and the continuity toward the spinal cord, the brain anatomical chart becomes an essential learning tool.
Whether for a course, training, an office, or personal curiosity, this collection offers an anatomical aid that facilitates explanation, supports the search for understanding, and provides a durable reference.
- Selecting an option updates the entire page.
- Opens in a new window.

 Sold out